I developed a miniaturized fluorescence-based immuno-assay on a microarray, and adapted a liquid-phase surface chemistry protocol to a vapor-phase protocol for microsystems.
Microarrays contain thousands of spots with biological probes, like DNA or proteins, attached to the surface via a chemical layer. They rely on fluorescence and help scientists test many different samples in parallel.
My goal was to adapt an antigen-antibody biological test, which had been developed in capillaries, to a planar format designed for DNA biochips. I brought these two techniques together and partnered with nearby labs to study this biological interaction with real-time fluorescence, lasers, and neutrons. I also adapted the protocol to work in fragile microsystems used in the preparation of samples and the analysis of proteins.
Overview
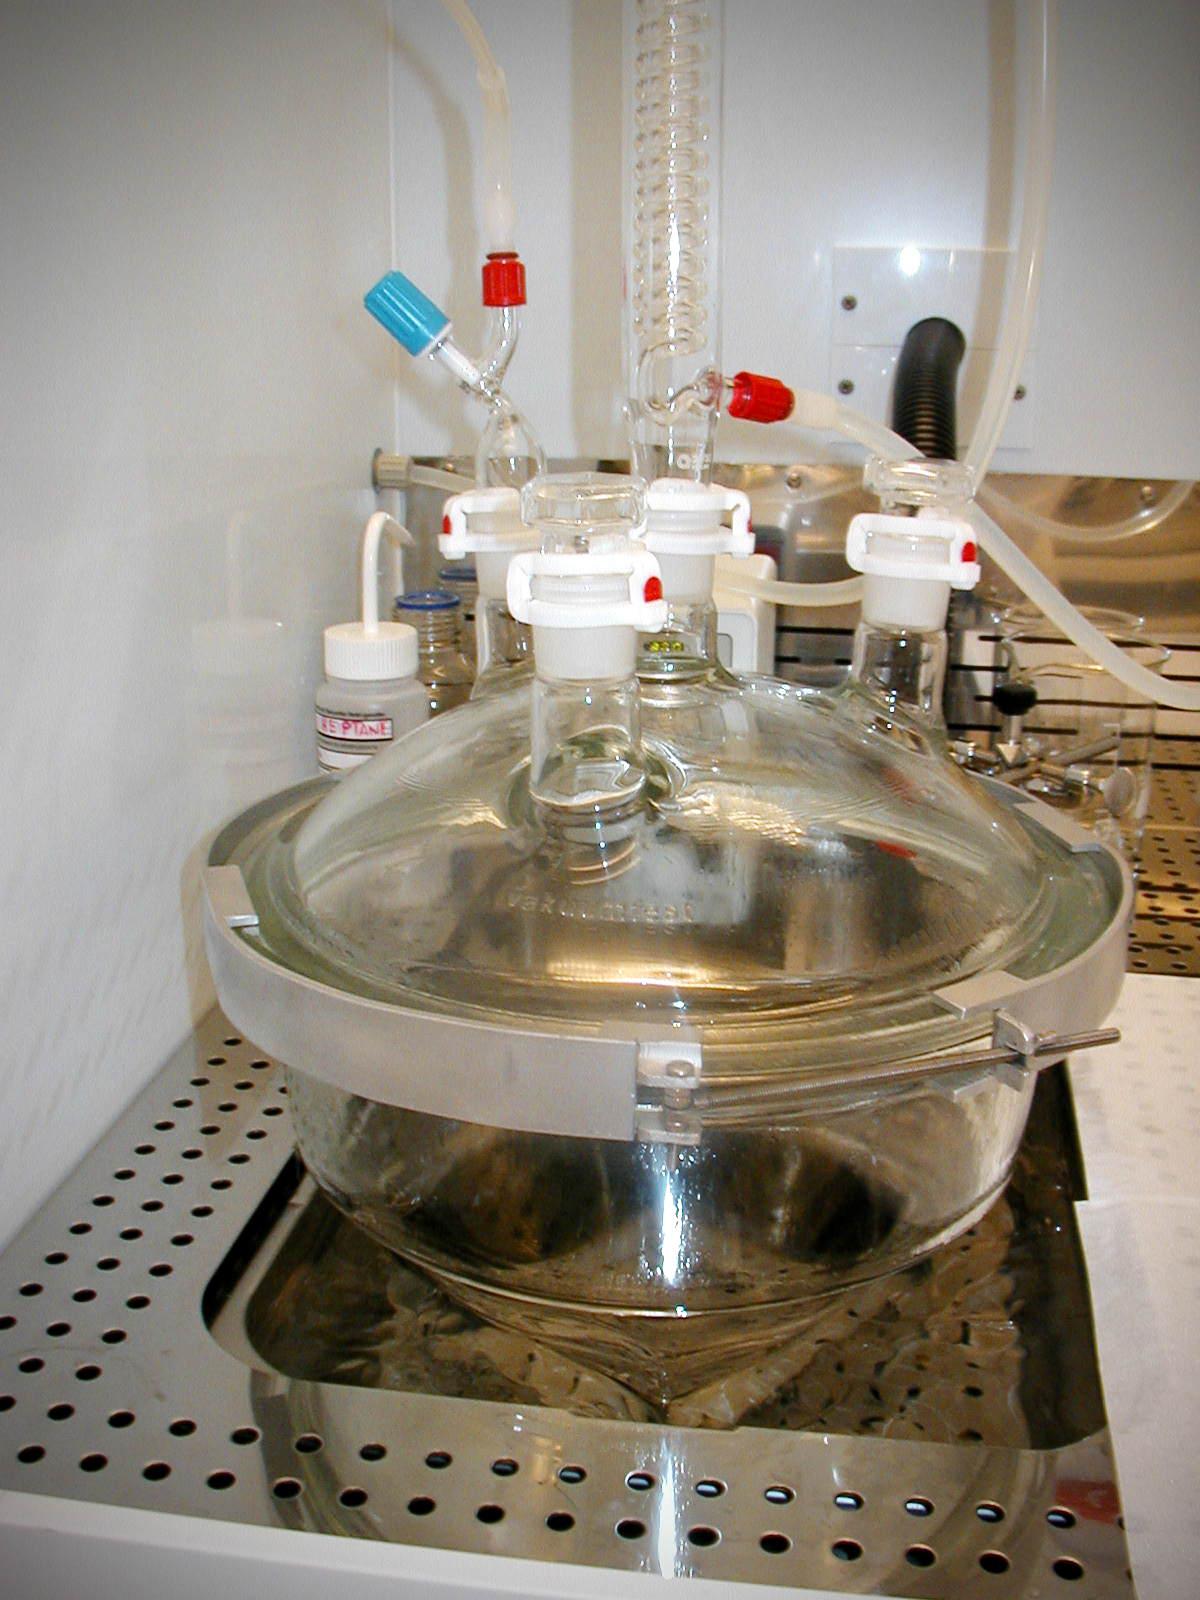
A large desiccator serves as silanization reactor. Modified to hold up to forty glass slides or twenty-five 100-mm wafers, it improves reproducibility by silanizing substrates in bulk.
I conducted this research with Guillaume Delapierre at the Laboratory for Functionalization and Chemistry for Microsystems (LFCM) at CEA-Léti in Grenoble, France.
Technical abstract
In this study, I adapted a capillary-based immunoassay to a planar fluorescence microarray, and developed a vapor-phase silanization protocol for use in peptide digestion microsystems.
The biological model concerns a neuropeptide known as Substance P (SP), and the anti-SP monoclonal antibody mAb SP31. These molecules are grafted on functionalized glass slides using the CEA-2 liquid-phase silanization protocol, based on 5,6-epoxyhexyltriethoxysilane. The amine functions of the proteins and peptides covalently bind to the silane’s aldehyde ending. I developed two tests: immobilization of antibodies revealed with fluorescent antigens, and immobilization of peptides revealed with marked antibodies. The binding of biological probes on the surface was optimized, as well as the revealing steps with the target. I characterized the chemical and biological layers using contact angle measurement, photothermal deflection spectroscopy, and neutron reflectometry.
In order to transfer this protocol to microsystems, I developed a vapor phase adaptation of the CEA-2 silanization protocol, and validated it using fluorescence, contact angle measurement, and atomic force microscopy. After optimizing the protocol on glass slides with the SP/anti-SP model, I applied it to microsystems for proteomics. In particular, I explored the vapor-phase silanization of peptide digestion microreactors developed for the BioChipLab project.
Biochips and microarrays
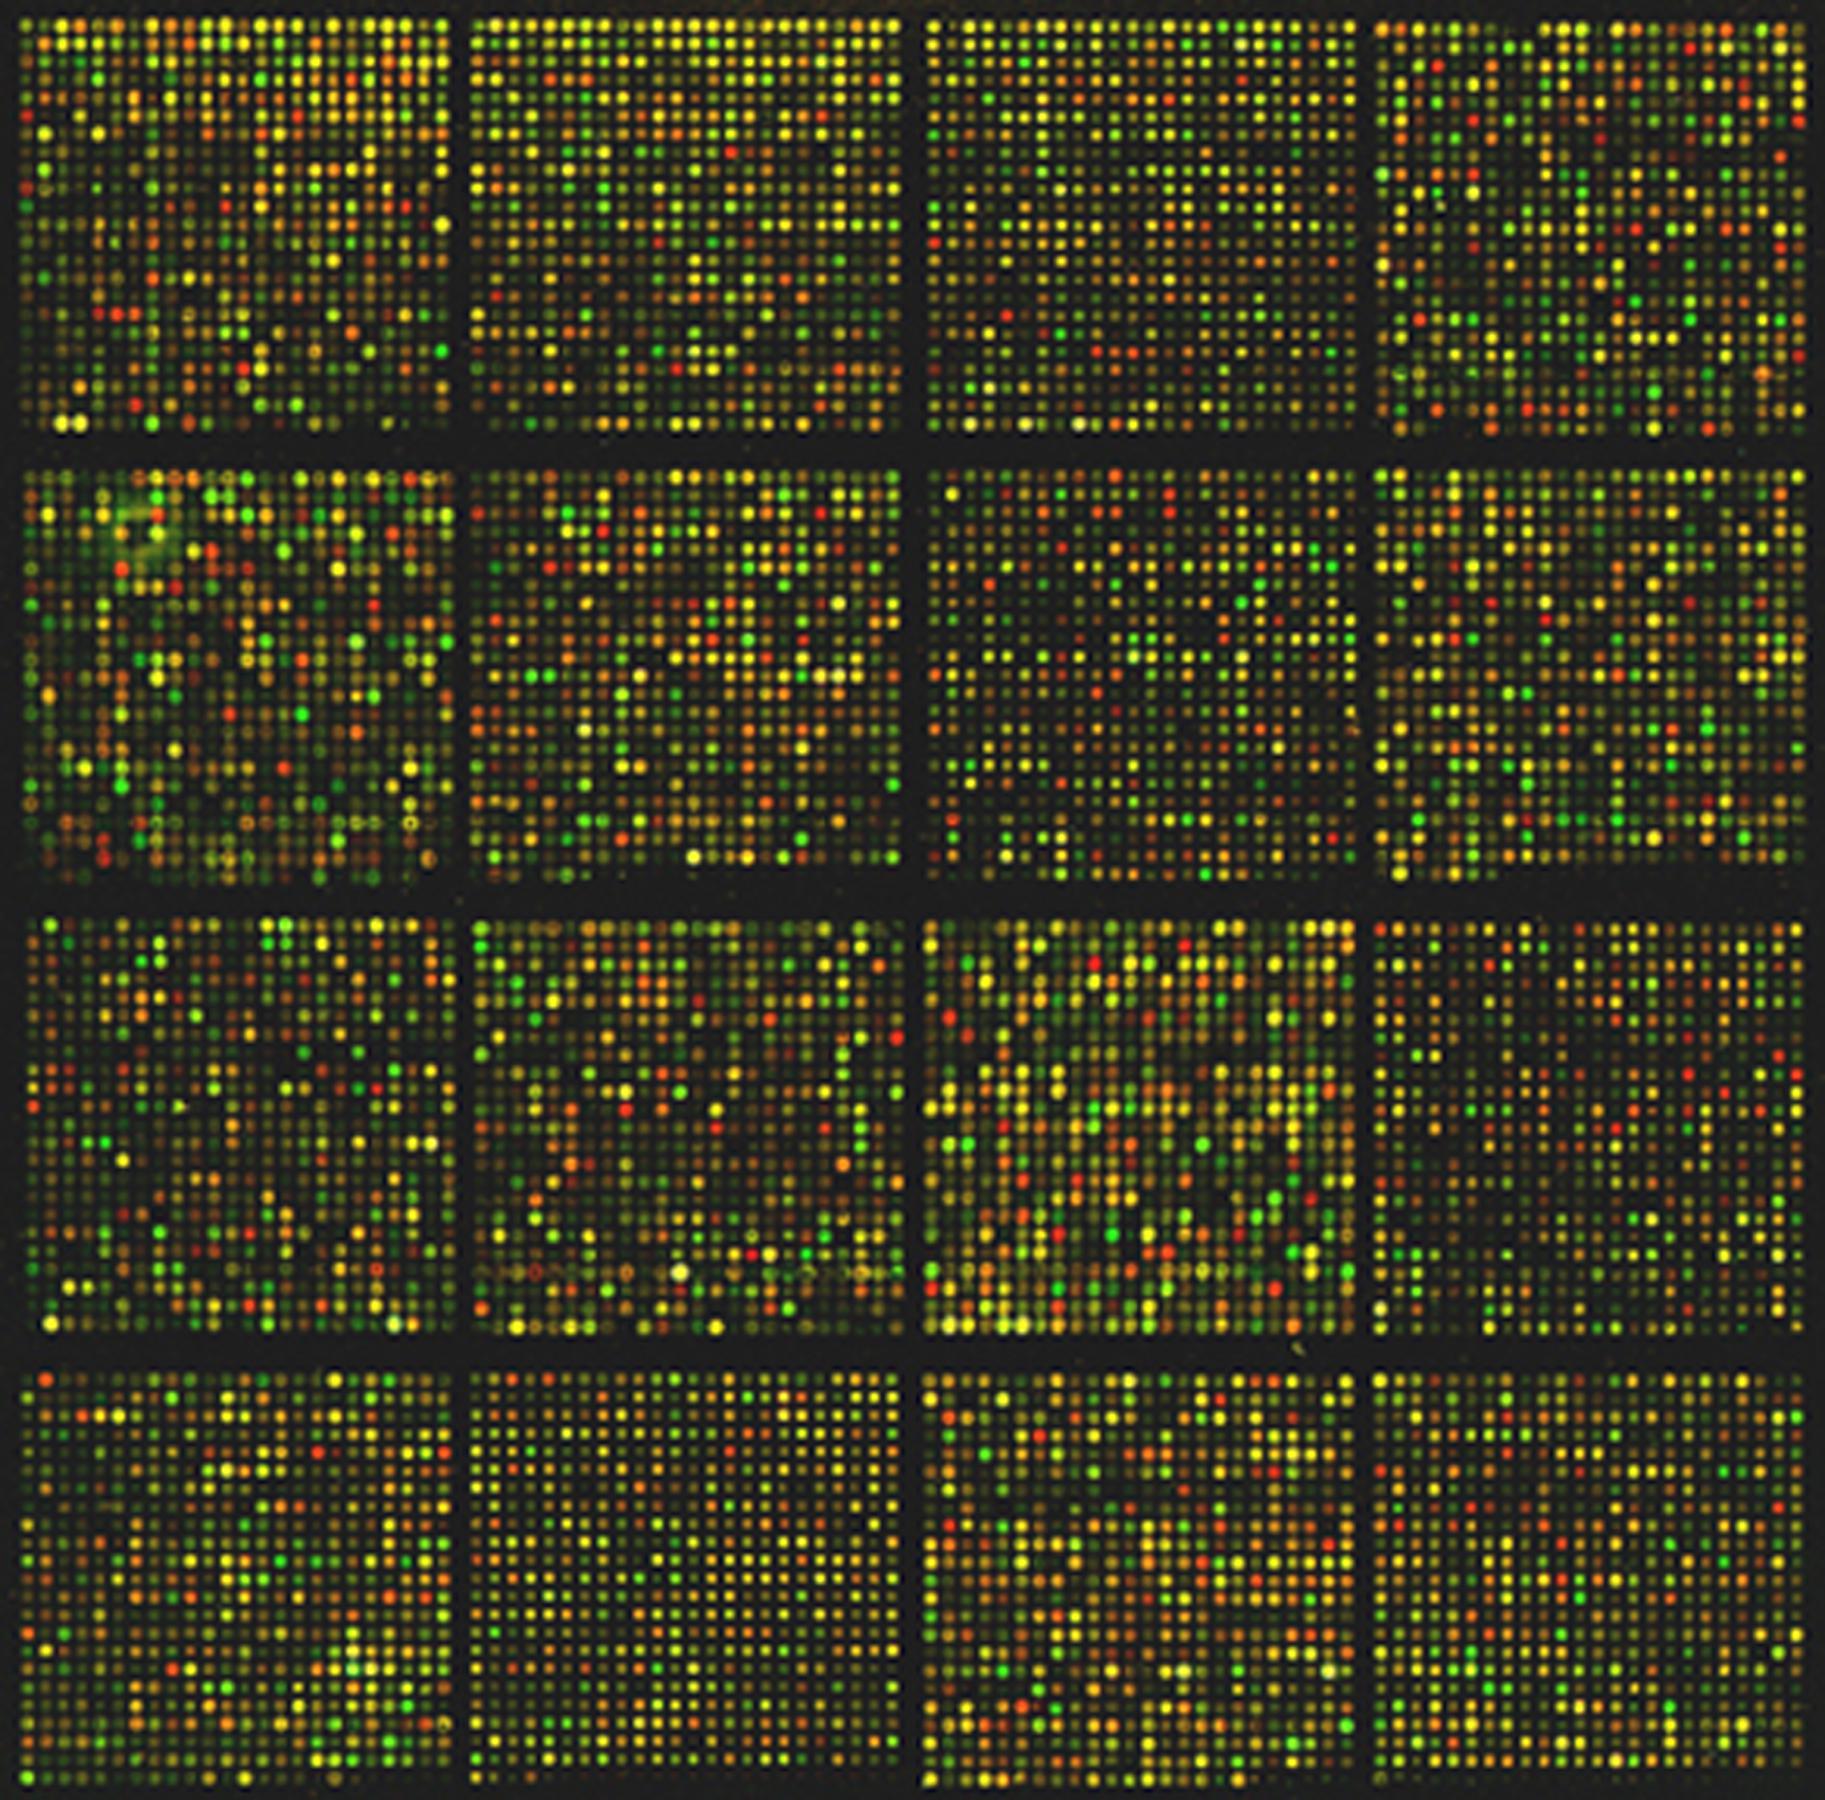
Louis M. Staudt/NIH on Wikimedia Commons // Public domain
Microarrays contain thousands of spots with biological probes, like DNA or proteins, attached to the surface via a chemical layer. They rely on fluorescence and help scientists test many different samples in parallel.
Mass parallel testing
Whether it is to find a vaccine, discover new drugs, diagnose patients, or study DNA, the motto is often the same: conduct more tests, more quickly. Mass testing enables biologists to try more molecules and vary experimental conditions, which helps them find the proverbial needle in the haystack of combinations.
The principle of biochips is similar to how progress in microelectronics has led to an increase in computing power, by decreasing the size of transistors and integrating more of them into a single chip. In biochips, laboratory functions and samples are miniaturized and thousands of experiments happen in parallel on a single chip. This kind of high-throughput testing enables scientists to conduct experiments and test many molecules at the same time, thus increasing efficiency.
In particular, microarrays involve printing a large number of biological samples using a technology similar to inkjet printing. Small droplets are deposited on a surface in an regular pattern, leading to a high density of biological probes, and small amounts of biological materials used in each.
A variety of biological molecules can be printed into microarrays, like DNA, proteins, and antibodies. To ensure regularity and consistency, the samples are printed using a machine called a spotter, or micro-arrayer. The biological probes are printed as micro-droplets onto a chemical layer on top of substrates like glass slides.
Biological molecules, and antibodies in particular, are fragile. Droplets are printed very gently in order to maintain their cohesion on the surface. Glycerol is often added to the sample solutions to increase their viscosity, help the droplets keep their shape, and limit evaporation. Once printed, the samples must be cleaned softly and kept in an environment that preserves their integrity until the experiment is complete.
Fluorescence in biochips
Microarrays often rely on fluorescence as a detection mechanism. Fluorophores are molecules that absorb light at a certain color and re-emit it at another color. They are combined with biological molecules of interest to detect their presence or their interaction. Because fluorophores emit light at a different color (wavelength) than what they receive, scientists can separate the two colors, and measure only the light emitted in return: it indicates how many biological molecules (DNA strands, antibodies, etc.) are in a specific spot.
The intensity of fluorescence emitted by the molecules is measured by a scanner or a microscope, leading to grayscale images where brighter zones indicate more fluorescence emitted than darker ones. A palette of false colors is then used to interpret the results.
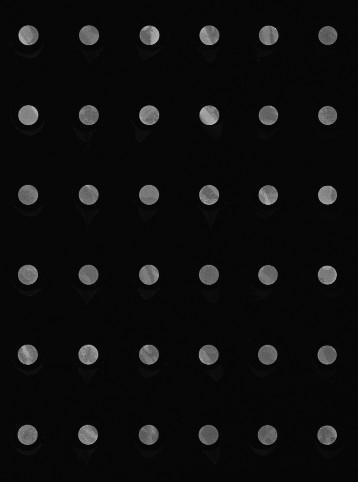


Fluorescence is measured at the wavelength of the light emitted by the fluorophore, to filter out the light used to excite it. The raw image (left) therefore only measures intensity, from dark (no signal) to bright (fluorescence emitted). The final image (right) shows false colors after applying a palette for visualization (bottom).
Surface functionalization
Scientists from the LFCM laboratory have developed a chemical protocol to attach biological molecules to an inorganic surface like glass or metallic oxides.[1] Known as “CEA-2,” the protocol is based on a silane (a molecule that contains an atom of silicon) and therefore called silanization. The process involves successive steps that progressively modify the molecules on the surface using chemical treatments. In the final step, biological molecules of interest are spotted on the modified surface and bind to the chemical layer.
The CEA-2 protocol is an established way to attach biological molecules to surfaces, and is routinely used in the lab to print DNA microarrays on glass slides (as oligonucleotides). The slides are usually silanized in bulk to increase consistency and reproducibility of results.

Chemical formula of 5,6-epoxyhexyltriethoxysilane (CAS: 86138-01-4), the basis for CEA-2 surface functionalization. EtO represents ethoxy groups CH3CH2O–.


In technical terms, after a surface activation in a basic environment, the silanization binds 5,6-epoxyhexyltriethoxysilane to the surface and creates Si—O—Si bonds. The silane’s epoxide function is then opened into a diol function by acid hydrolysis. The last step, which consists in oxidizing the diol into an aldehyde, is done immediately before grafting biological probes, whose amine functions bind to the silane’s aldehyde.
Antibody microarray on CEA-2 protocol
My goal was to adapt an antigen-antibody biological test, which had been developed in capillaries, to a planar format designed for DNA biochips. I brought those two techniques together, showed the feasibility of printing antibody microarrays on the CEA-2 chemical layer, and studied experimental parameters to optimize the protocol.
Substance P
Substance P (SP) is a neurotransmitter from the neurokinin family, synthesized by neurons and able to excite nearby neurons. SP is involved in many physiological systems, including the transmission of pain information to the central nervous system.

Chemical structure of Substance P.
Substance P was used as a model molecule in the development of a novel approach to detect biological warfare agents, led by Laure-Marie Neuburger of the Laboratoire d’Études et de Recherches en Immunoanalyse (LERI).[2] Laure-Marie had been developing the immunoassay in capillaries, and produced the antibodies and antigens, conjugated with fluorophores or other molecules. I adapted Laure-Marie’s immunoassay to planar microarrays using the CEA-2 protocol, traditionally used for DNA biochips.
Laure-Marie Neuburger. Design of fluorescence immunoassays. Perspectives for continuous monitoring of biological warfare agents. Ph.D dissertation. Chemical Sciences, AgroParisTech, 2006. pastel-00004770.
Immunoassay protocols
I conducted several protocols all involving antibody microarrays, or immunoassays. They all involved a preliminary silanization to prepare the glass surface and coat it with a chemical layer. Biological probes (antibodies) are then spotted in droplets on that layer, and left to immobilize overnight in a high-humidity environment to prevent evaporation.
Once the probes are bound to the chemical layer, the surface is rinsed to remove excess molecules, and blocking proteins are attached to saturate free active sites on the surface. Blocking proteins make sure that nothing else can attach in areas that aren’t covered with antibodies, including fluorescent markers. Preventing this non-specific adsorption limits background noise during detection.
A solution containing the target molecules (antigens/peptides) is then deposited on the spotted surface, and left to incubate under a plastic cover slip. If the peptides are marked with a fluorophore, then detection is direct: after rinsing and drying the surface, the results are obtained directly from the fluorescence scanner.
Some peptides are not directly marked with a fluorophore, but rather with a biotin, a small vitamin. Biotin has an extraordinarily high affinity for streptavidin, a larger protein; their bond is one of the strongest known non-covalent interactions. Such biotinylated peptides can be indirectly detected using streptavidinated fluorophores, meaning fluorophores attached to a streptavidin. The antibodies themselves can also be marked with a biotin, to check their presence on the surface independent of their interaction with peptides.

Stages of the protocol for three possible antibody microarray tests: (a) Direct verification of the immobilization of biotinylated antibodies on the surface, using streptavidinated fluorophores. (b) Direct reading of the binding of fluorescent peptides on immobilized antibodies. (c) Indirect reading of the binding of biotinylated peptides on immobilized antibodies, using streptavidinated fluorophores.
Parameter study & protocol optimization
Biological tests, and immunoassays in particular, can be difficult to control because they depend on so many different parameters: duration and temperature of the successive steps, humidity, blocking proteins, buffers, etc. In order to increase the reproducibility of our tests, I worked with fellow engineer Isabelle Mingam to study those parameters and optimize them for the most consistent results.
The tests confirmed the need for blocking proteins to limit background noise, and a small amount of glycerol to limit the evaporation of droplets. We also found out that the drying step, done by centrifuge for DNA microarrays in the lab, might be too strong for antibodies: a softer drying method better preserved their integrity, in particular their antigen-binding site (paratope) needed to recognize and attach molecules of interest.
Alternative detection methods

Using fluorescence to reveal the antibody-antigen interaction after a period of incubation was the primary technique I used to develop the immunoassay. There are many other characterization methods for chemical surfaces and biological layers; I partnered with three nearby labs to study our biological model using real-time fluorescence, lasers, and neutrons.
Reaction kinetics
All the fluorescence-based experiments conducted so far were done after a period of incubation between antibodies and peptides. I worked with Rémi Galland, from the CEA’s Laboratoire d’Imagerie des Systèmes d’Acquisition (LISA), to study the kinetics of that interaction in real time.[3] The principle of the experiment was similar to previous immunoassays, except that fluorescence wass measured continuously as the target peptides, marked with fluorophores, were introduced into the system.
Rémi Galland. Mise en œuvre de concepts de détecteurs optiques de fluorescence intégrant la source de lumière au composant pour des immunoanalyses adaptées à des applications hors laboratoires. Ph.D dissertation. Biophysics, Université Joseph-Fourier — Grenoble I, 2008. tel-00332307.

Principle of real-time measurement of the interaction between antibodies and peptides.
Our exploratory work showed promising results: we were able to observe a rapid increase in signal during the first few minutes of the experiment, showing a plateau (indicating saturation) after about 30 minutes. The signal then decreased over time due to photobleaching (the gradual fading of fluorophores under the exciting light). These results prompted us to experiment with shorter incubation periods (described above).

Reaction kinetics between mAb SP31 antibodies, grafted on CEA-2 chemistry, and fluorescein-marked LMN1 peptides in solution at 1 nM (P = 500 µW, D = 0.5 mL/min, pH = 7.4).
Photothermal deflection spectroscopy
Photothermal deflection spectroscopy (PDS) is a technique used to characterize thin layers by measuring the change in refractive index of a sample due to heating by light. In other words, one laser heats a surface to different degrees depending on what’s on it; another laser is shone through the same surface, and the way it’s deflected by heat provides information on what’s there.

Experimental apparatus for transverse PDS from Jackson et al.‘s 1981 article “Photothermal deflection spectroscopy and detection.” Applied Optics. 20 (8): 1333–1344.
In technical terms, an Argon laser provides the pump beam that heats up the surface. It’s focused by mirrors rather than a dioptric system, which could cause chromatic aberrations. The probe beam from a 2 mW He-Ne laser is detected by a quadrant photodiode. The LICP’s experiment is set up for Transverse PDS, where the pump beam comes in normal to the surface, and the probe beam passes parallel.
The substrate’s surface undergoes the usual CEA-2 process, and mAb SP31 antibodies are grafted onto it. A solution of biotinylated antigens is incubated on the surface, followed by streptavidinated gold nanobeads with a 10 nm diameter. The presence of the gold nanobeads is finally detected by PDS.
The principle of the immunoassay is the same as in fluorescence experiments, except the final detection step to visualize antibodies and antigens is done indirectly using gold nanoparticles rather than a fluorophore. For this experiment, I partnered with Violaine Vizcaino, from the CEA’s Laboratoire d’Ingénierie des Composants Photoniques (LICP).[4]
Violaine’s technical report isn’t publicly available, but Wikipedia’s article on photothermal spectroscopy provides a general overview of the technique, and details about the LICP’s experimental setup are available (in French) in Appendix B of my own report (PDF, 3.2 MB), pages 69−72.
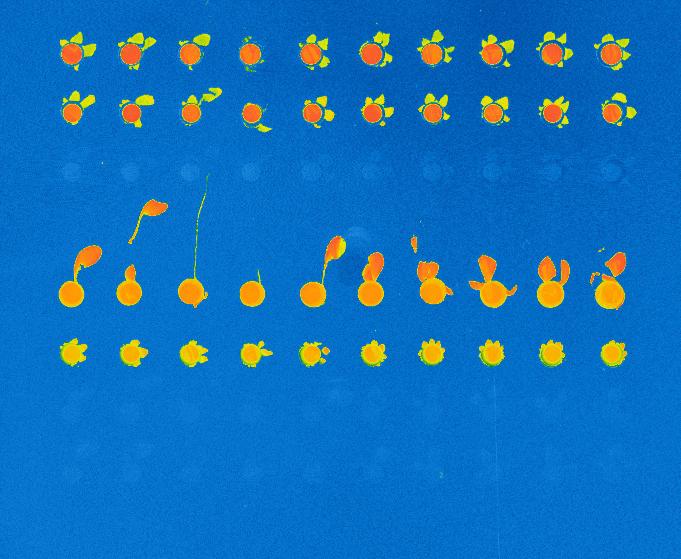
Although we admittedly used a highly concentrated antigen solution for this exploratory experiment, we were able to detect antigens on their specific antibodies, indicating that the interaction had taken place. No signal was detected on the control antibodies, indicating that the interaction was specific to our probes.
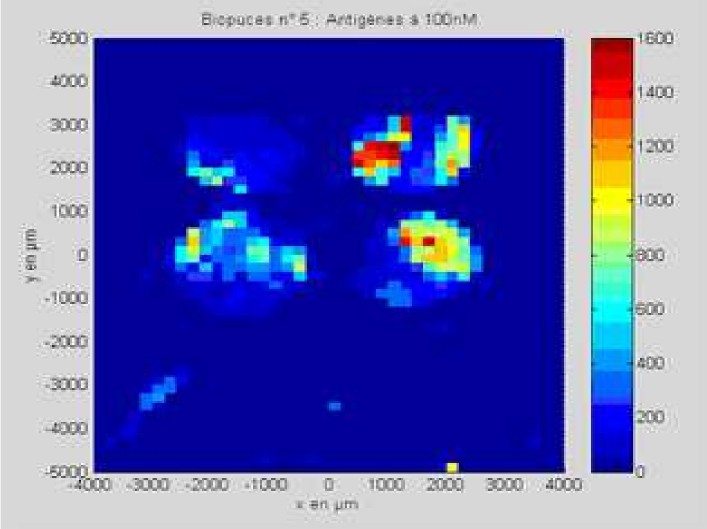
Result of the PDS experiment in false colors for a 100 nM antigen solution. Antigens are detected (via gold nanobeads) on the first two rows containing specific antibodies, but not on the third row containing control antibodies.
Antibody mAb SP31 1 μM, 2% glycerol
Antibody mAb SP31 1 μM, 2% glycerol
Control antibody Il2-73 1 μM, 2% glycerol
Neutron reflectometry
Towards the end of my time at CEA-Léti, I was offered the opportunity to visit the neighboring Institut Laue-Langevin (ILL), and to study my immunoassay layers using neutron reflectometry. I worked in collaboration with Giovanna Fragneto to prepare the samples, and subject them to the ILL’s intense neutron source inside its D17 reflectometer.[5]
R. Cubitt and G. Fragneto. D17: The new reflectometer at the ILL. Appl. Phys. A 74, s329—s331 (2002). doi:10.1007/s003390201611, full text (PDF, 140 KB)
Neutron reflectometry is a technique used to study thin films by shining a tight neutron beam from a high flux nuclear reactor onto a very flat surface, and measuring the intensity of the reflected radiation. It is particularly adapted to the study of stratified biological layers, because neutrons are highly penetrating and not as damaging as X-rays to delicate samples like ours.
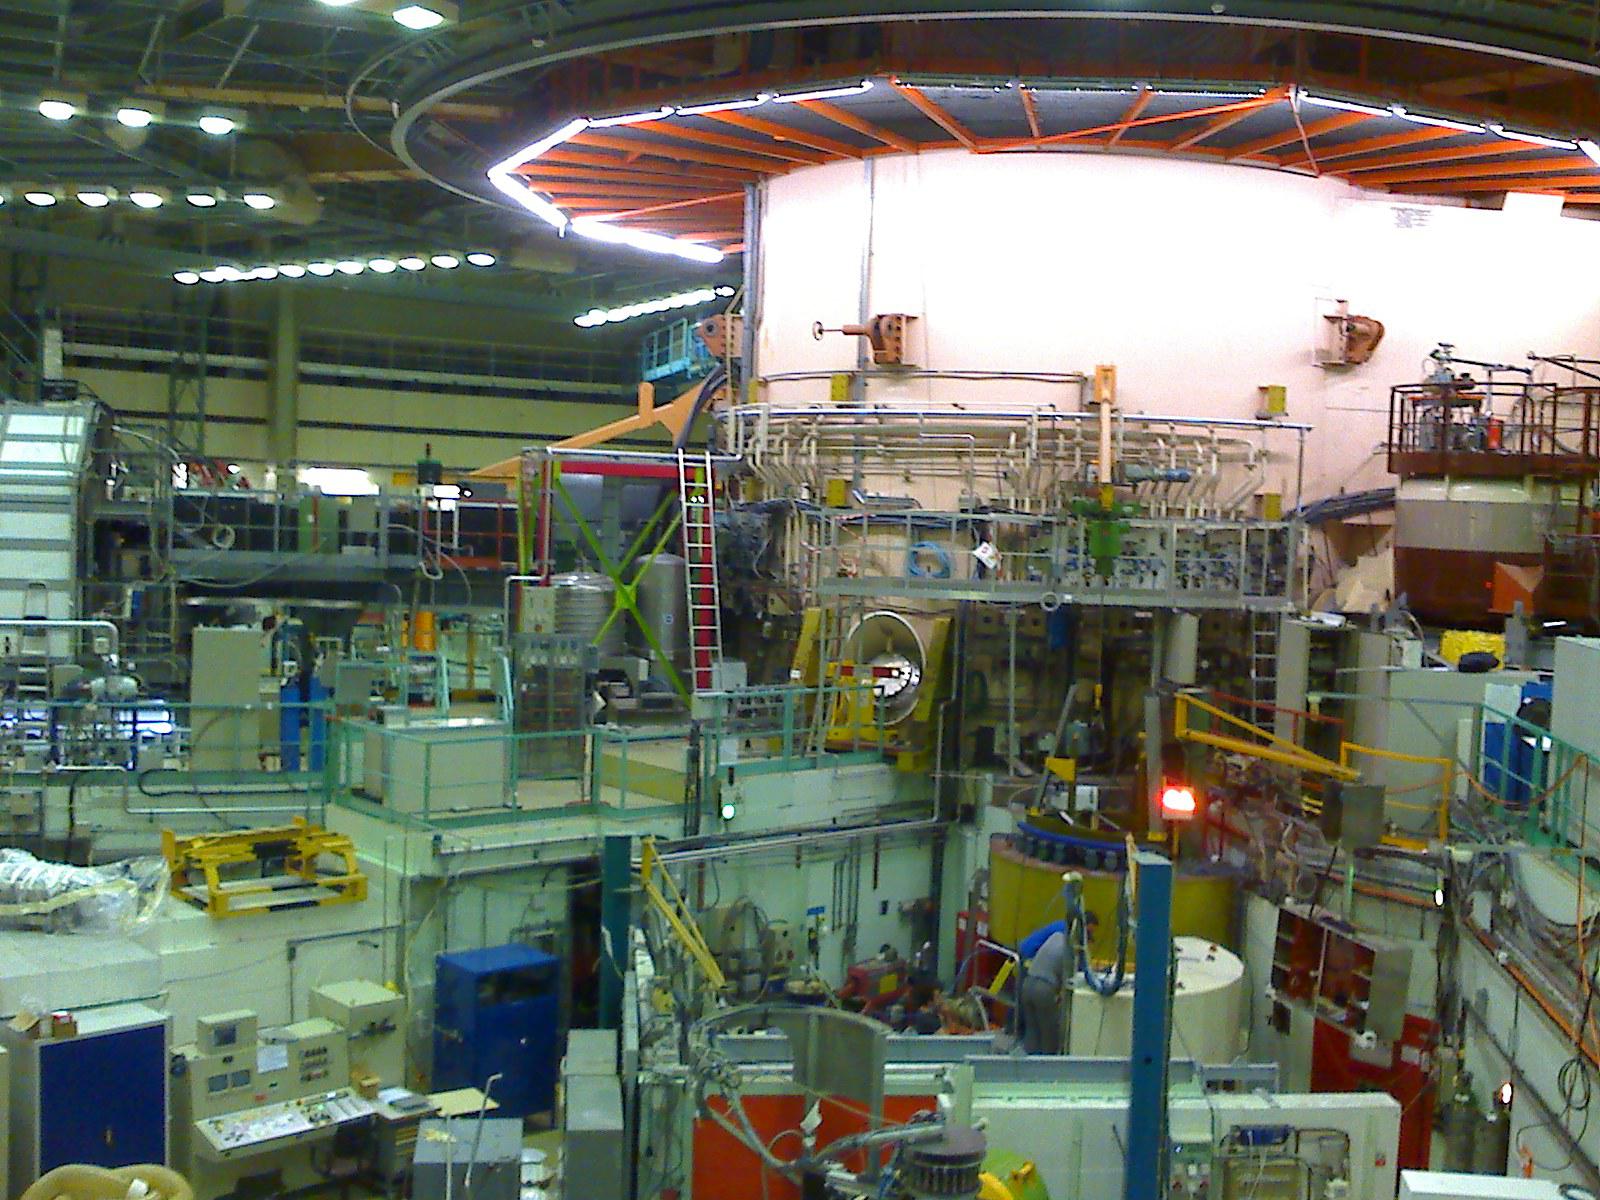
Inside the hall of the high-flux nuclear reactor at Institut Laue-Langevin in Grenoble, France. (Nerd bzh on Wikimedia Commons // CC BY-SA 3.0)
We conducted experiments with different liquids to provide contrast: water (H2O), heavy water (D2O), and silicon-matched water (SMW). SMW is an H2O/D2O mixture with a neutron scattering length density (SLD) (ρw = 2.07 × 10⁻⁶ Å−2) that matches that of the silicon substrate, to facilitate measurement of the layers of interest.
Because antibodies are much larger than antigens, we inverted the immunoassay protocol to attach antigens on the surface first, and then incubate them with antibodies, rather than the other way around. Our hypothesis was that this would make it easier to detect changes in the thickness of the biological layers.
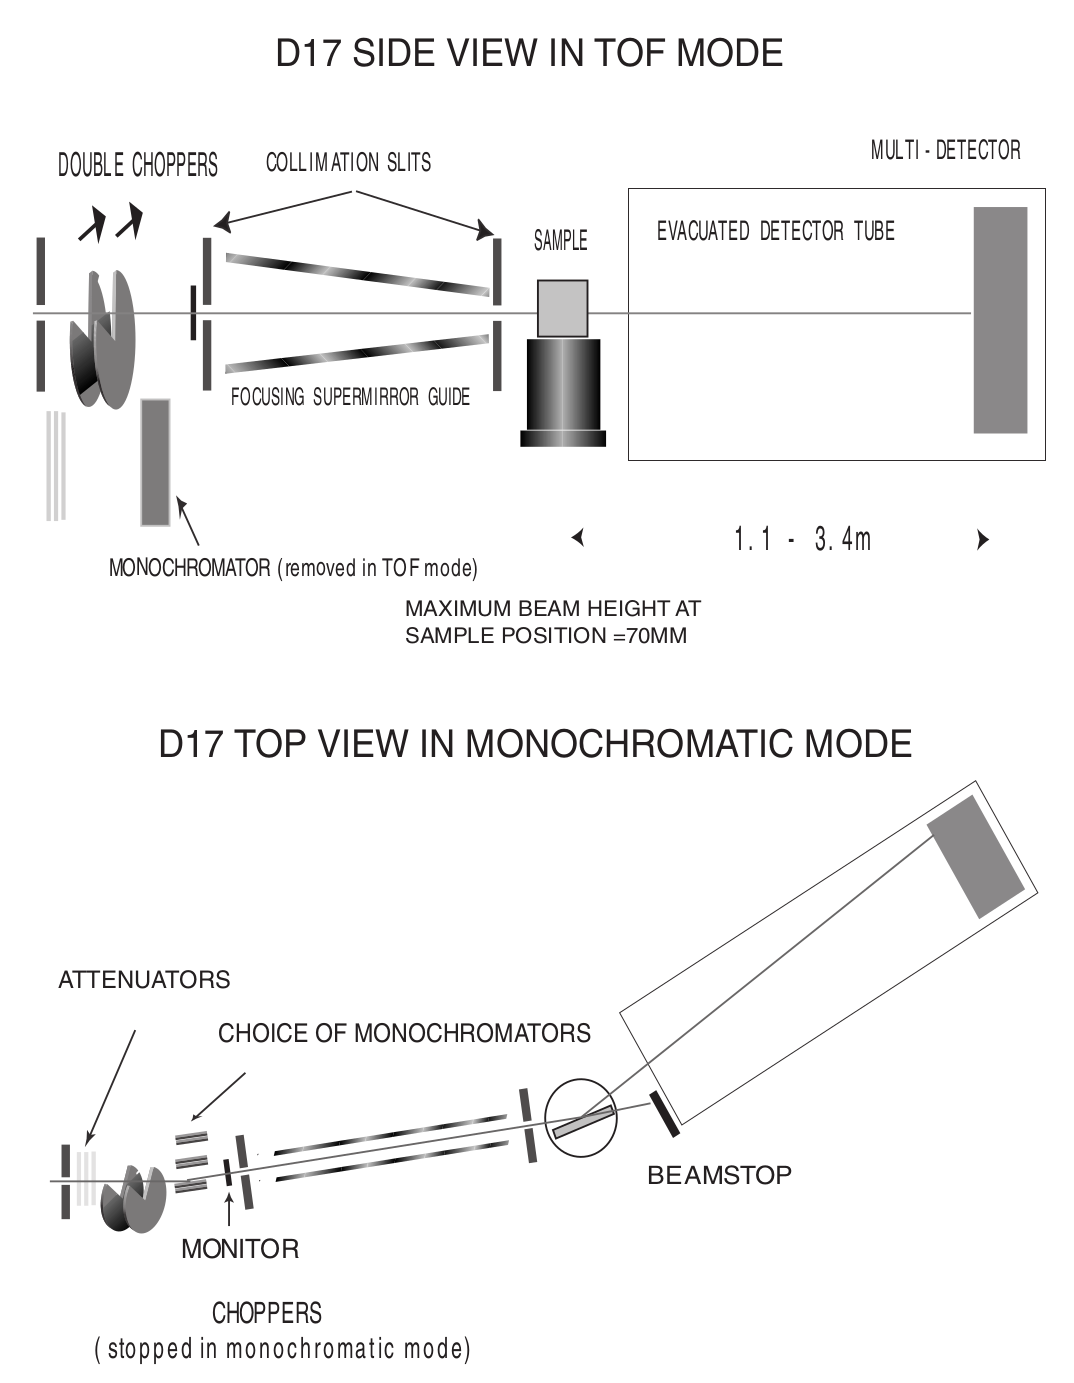
Two modes of operation of the D17 reflectometer (Cubitt & Fragneto). D17 has a horizontal scattering geometry and offers two modes of operation: a monochromatic mode, and a time-of-flight mode (TOF) for dynamic studies like reaction kinetics.
Our results (see table below) were consistent with layers of native silicon oxide, silane, and antigens. The blocking proteins increased the density of the antigen layer, which was consistent with the hypothesis that they saturated active free sites. However, the results for antibody layers were unexpected, showing thinner layers than with just the antigens. One explanation might be that our sensitive biological molecules, usually preserved in chemical buffers, were denatured during the experiment, and couldn’t attach specifically.
Layer |
Thickness (nm) |
SLD (× 10−6 Å−2) |
Rugosity (Å) |
|---|---|---|---|
SiO2 |
1.3 |
3.41 |
0.4 |
Silane |
0.7 |
−0.4 |
0.4 |
LMN1 peptide |
6.7 |
1.4 |
1.2 |
LMN1 peptide + BSA |
6.6 |
1.7 |
1.4 |
LMN1 peptide + BSA + specific antibody |
5.7 |
1.2 |
1.2 |
LMN1 peptide + BSA + control antibody |
5.7 |
1.2 |
1.2 |
Confirming the presence of the mixed layer of antigens and blocking protein would require deuterating one of those two substances, meaning replacing hydrogen by its heavier isotope, deuterium, to vary their contrast. To avoid the possible denaturation of antibodies, preparing buffers using D2O and silicon-matched water would provide contrast while preserving a physiological environment adapted to biological molecules. Although I wasn’t able to conduct these follow-up experiments before the end of my contract, I still felt privileged to have been able to glimpse into this entirely different field of physics.
Vapor-phase silanization for proteomics

I adapted the CEA-2 chemical protocol to attach the silane as a gas instead of in a liquid solvent, which can damage some materials like those used in microdevices for protein analysis.
Adapting the protocol
All our experiments so far relied on attaching biological molecules to a chemical layer of silane, prepared on a flat surface like a glass slide, using the CEA-2 protocol. This liquid-phase silanization was done in organic solvents like toluene, which work well for glass and silicon substrates. However, they damage many other materials like polydimethylsiloxane (PDMS), a transparent and biocompatible polymer widely used in biological microsystems.
When such polymers are involved, another solution is to conduct the silanization in vapor phase: instead of diluting the silane in a solvent, the liquid silane is turned into a gas that attaches to the surface. My goal was therefore to adapt the regular, liquid-phase CEA-2 protocol to a vapor-phase method, by heating the silane in a closed container and depositing it on our surfaces.

Based on the scientific literature describing other silanes, I devised a protocol to silanize glass and silicon substrates in vapor phase, and compared their properties to those prepared with the liquid-phase CEA-2 protocol. I placed the slides in a tight Teflon container with a small quantity of liquid silane, and heated the system to 130°C to establish a liquid-gas equilibrium. I experimented with different periods of silanization and ways to activate the surface (with O2 plasma and NaOH Brown).
Contact angle measurement
Measuring the contact angle of a droplet of water is a fast and easy way to characterize a surface. On a hydrophilic surface, which attracts water, the droplet spreads out and yields a low contact angle. On a hydrophobic surface, which repels water, the droplet bulges out and gives a higher angle.
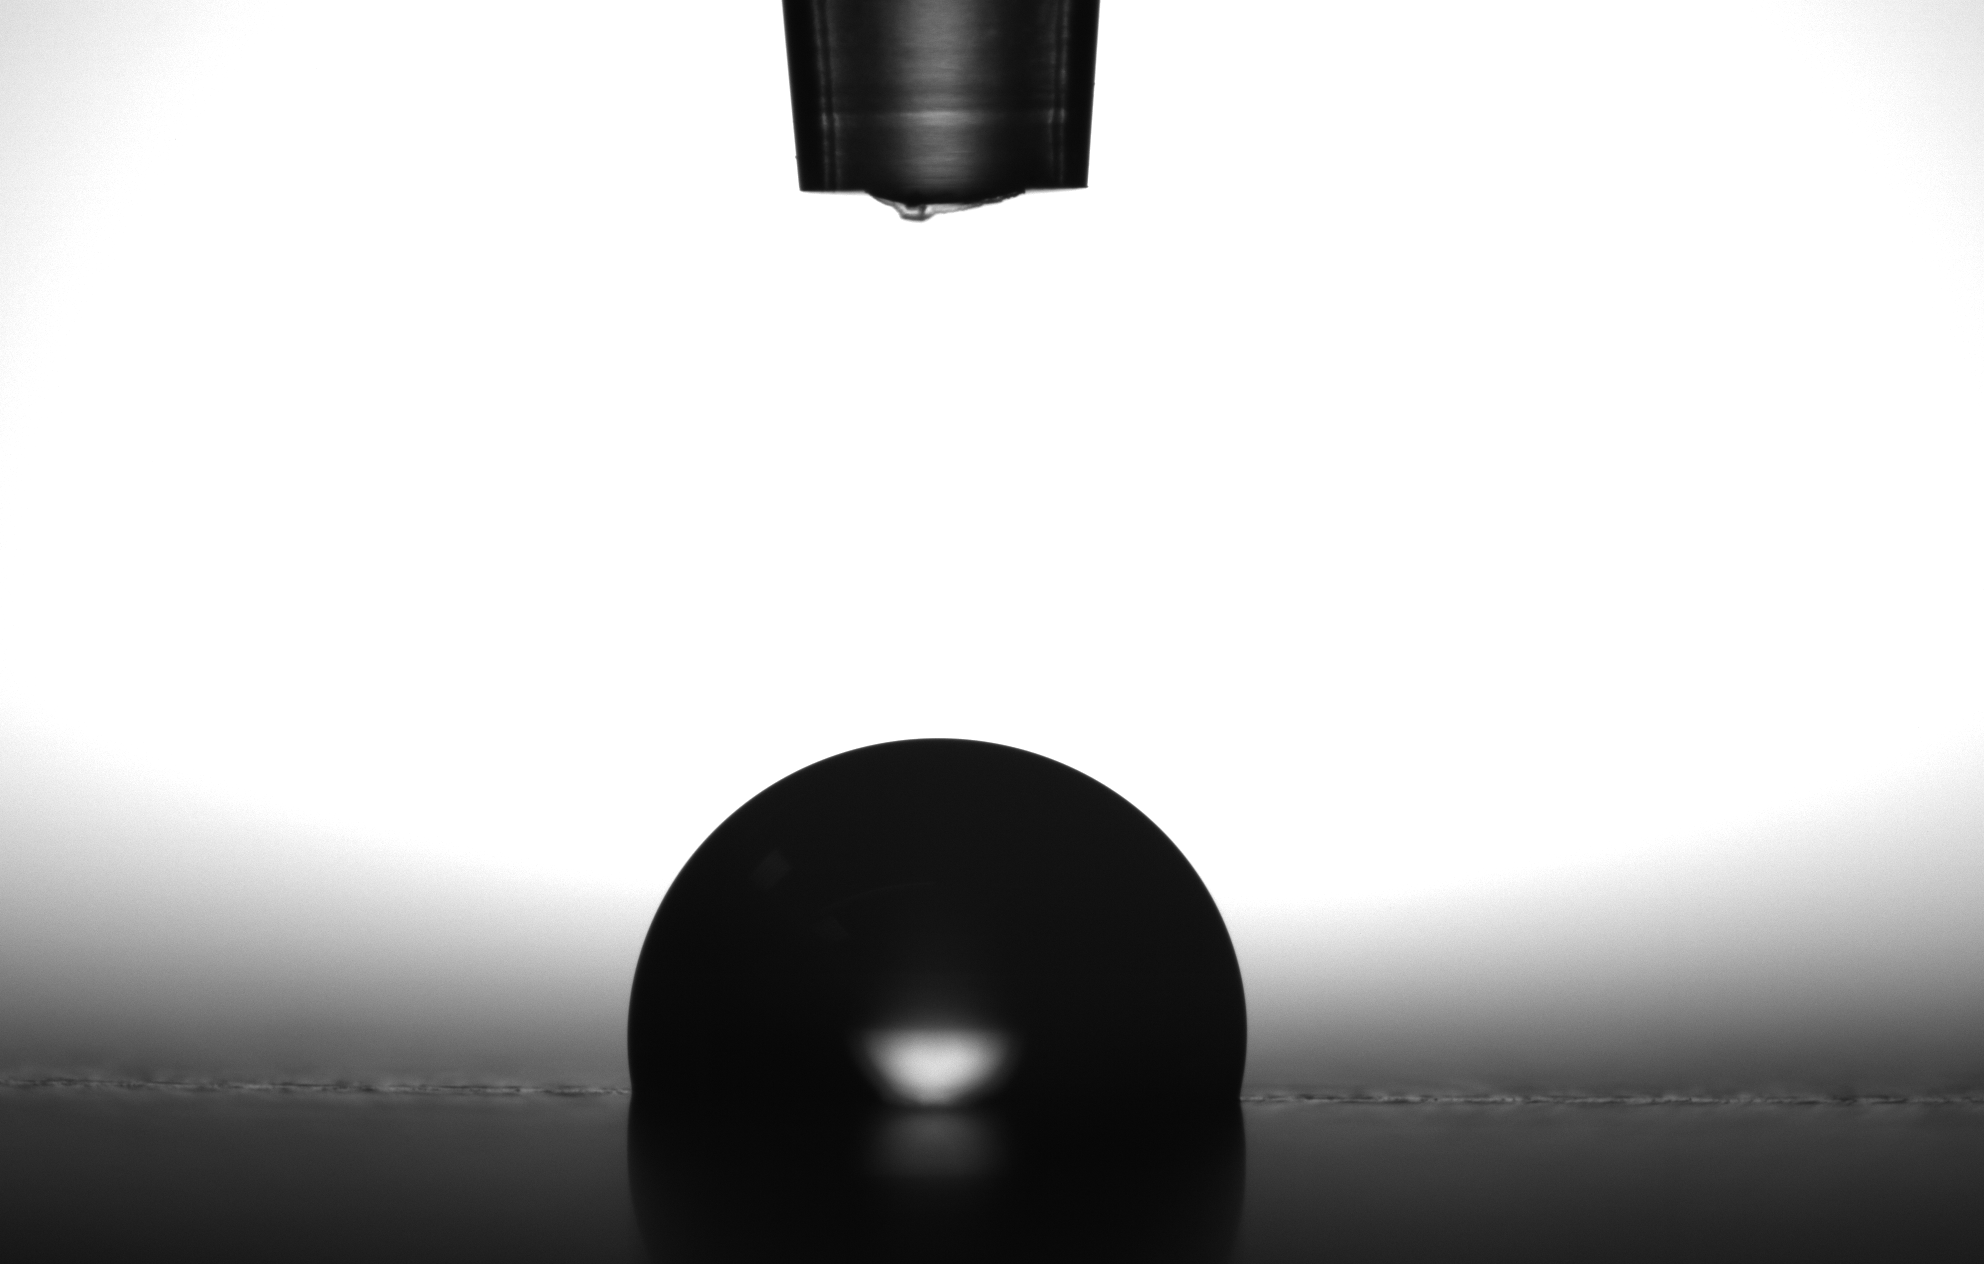
The sessile drop technique provides information on the properties of a surface by measuring the contact angle of a droplet of liquid dropped on it (Jyrkorpela on Wikimedia Commons // CC BY-SA 4.0).
This method only provides limited information, because different materials and layers can lead to the same angle. However, standardized chemical protocol like CEA-2 have well-known contact angles that correspond to the chemical functions present on the surface at each stage.
Therefore, I compared the contact angles of surfaces prepared with the CEA-2 protocol in vapor phase and in liquid phase, at two different stages of the process. The results indicated similar angles between vapor and liquid phase for both stages, which was encouraging, although not definitive.

Comparison of contact angle measurement between liquid phase and vapor phase silanization at two stages of the CEA-2 process (epoxyde and diol).
Atomic force microscopy
Another method in the toolbox of the surface chemist is atomic force microscopy (AFM). By sweeping a microscopic tip very close to the surface, and measuring the interaction between the two of them, scientists can reconstruct an image of the surface at the nanometer scale.
I prepared two substrates with the vapor-phase and liquid-phase silanization protocols and observed them by AFM. The vapor-phase sample showed a smoother surface, with a rugosity (a measure of the small peaks and valley) of about 2 Å, close to that of a naked surface. By contrast, the rugosity of the surface prepared with the liquid-phase protocol was over 32 Å.
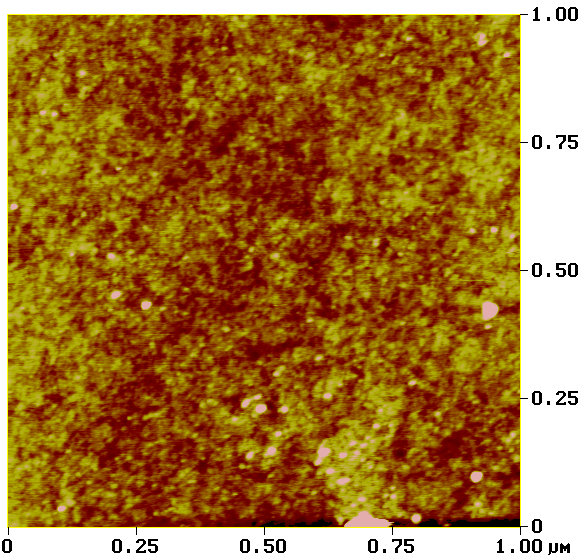
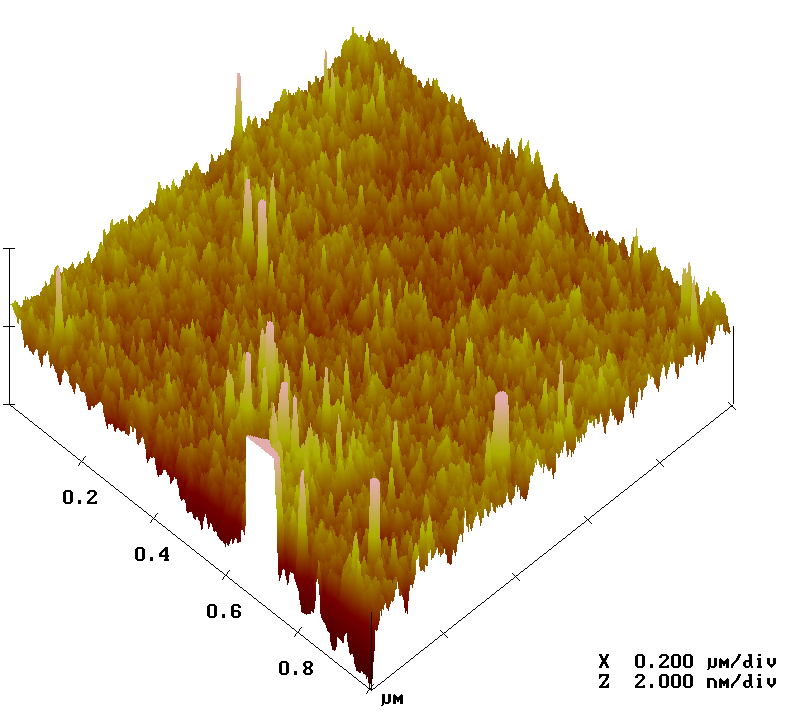
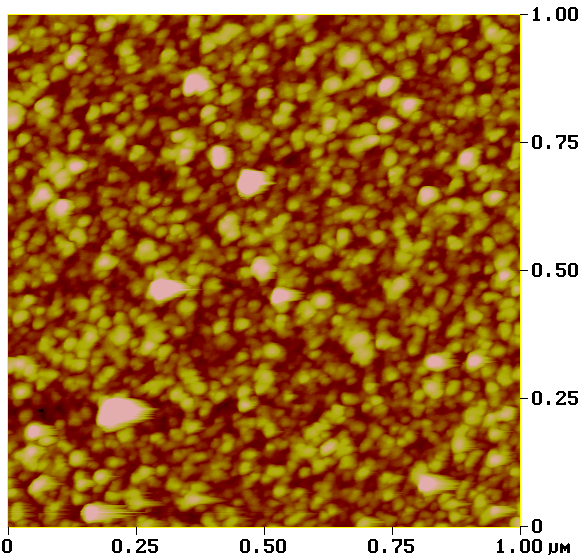
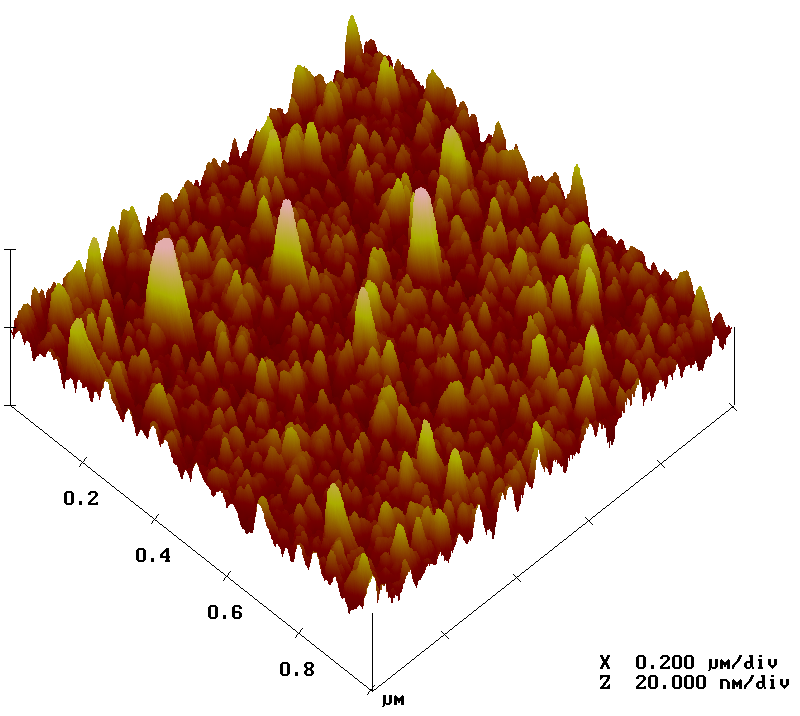
Analysis of surfaces functionalized with CEA-2 chemistry in vapor phase (top) and liquid phase (bottom), using atomic force microscopy.
On its own, this result might indicate that the vapor-phase silanization had failed. Taken individually, contact angle and atomic force microscopy don’t provide definitive proof of the success of the vapor-phase protocol. But since contact angles between protocols were consistent, the difference of rugosity might have been due to a more disorganized layer of silane deposited in liquid phase.
Antibody microarray on vapor-phase silane
I developed the vapor-phase protocol primarily for use in microsystems made with polymers that don’t hold up well with solvents, but it can also be used for immunoassays made on regular glass slides. Therefore, I printed antibody spots on surfaces coated with vapor-phase silanization, incubated them with fluorescent antigens, and compared the results to the same test prepared with the liquid-phase protocol.
The experiment was a success, with the antigens attaching to their specific antibodies and showing good fluorescence signal, similar to that on liquid-phase silanization. As expected, the antigens didn’t attach to the control antibodies, whose spots were barely distinguishable from background signal.


Comparison of the immunoassay on CEA-2 chemistry in vapor phase (top) and liquid phase (bottom), using fluorescence.
Antibody mAb SP31 1 μM, 10% glycerol
Antibody mAb SP31 1 μM, 10% glycerol
Control antibody Il2-73 1 μM, 10% glycerol
Peptidic digestion & Mass spectrometry
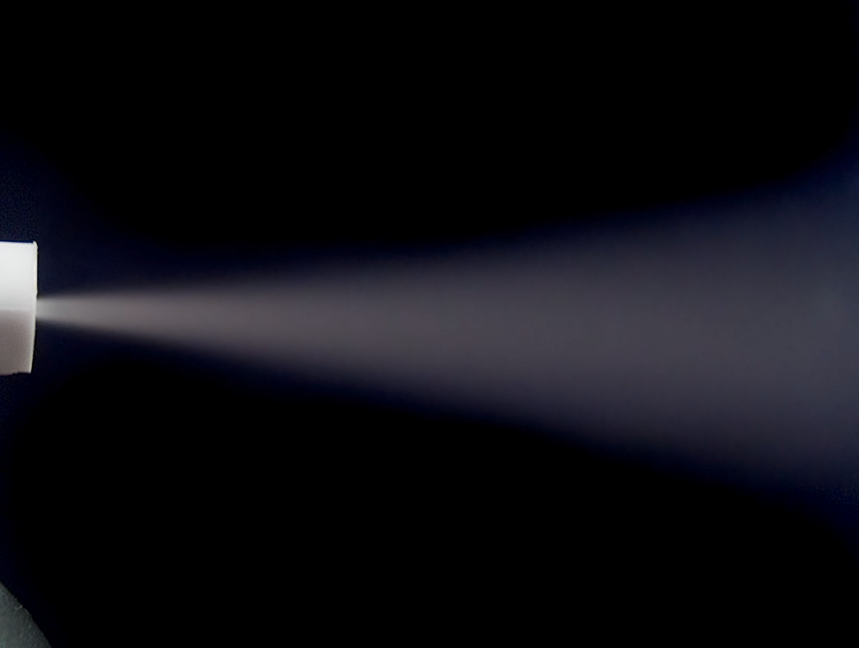
After developing a vapor-phase protocol for the CEA-2 chemistry, I applied it to the silanization of a microdevice used in the preparation of samples and the analysis of proteins.
BioChipLab
The field of proteomics is dedicated to the study of proteins in the same way that genomics is the study of an organism’s DNA. But whereas DNA remains more or less the same, proteins vary widely between cells and change over time. Proteins are also much larger molecules than DNA strands.
One technique used by scientists to study proteins consists in cutting them into smaller fragments (peptides), and using mass spectrometry to identify those fragments by their charge and mass. The final piece of my work at CEA was to use vapor-phase silanization on a closed miniaturized device, in order to attach an enzyme that would cut break down proteins for analysis. For this work, I partnered with Frédérique Mittler, from the LFCM lab.
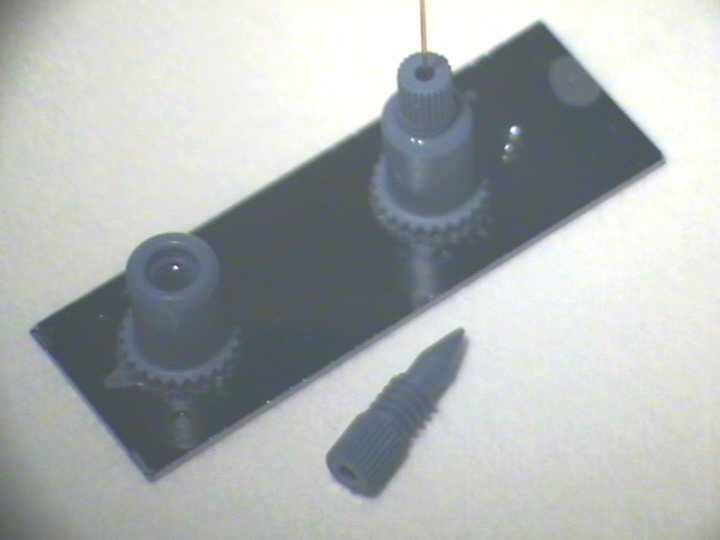
BioChipLab digestion module with connectors. (F. Mittler / CEA-Léti)
In technical terms, the goal of the BioChipLab project was to develop a microsystem coupled to a mass spectrometer for proteomics and pharmacology. It included microreactors, a digestion module, and an electrospray nozzle. My work focused on functionalizing the peptidic digestion module with vapor-phase CEA-2 chemistry in order to graft trypsin, an enzyme that catalyzes the breakdown of proteins into smaller peptides for analysis.
Fluorescence microscopy
The full analysis involved many steps: silanization, binding of the enzyme, digestion of the proteins, and analysis of the peptides by mass spectrometry. If the final spectrum results showed the peaks characteristic of the expected peptides, then we would have confirmation that the process was a success.
In order to experiment with the vapor-phase silanization and iterate more quickly, we first used devices with a transparent cover, and attempted to attach a fluorescent molecule on the silane. We were thus able to observe fluorescence in our device’s microchannel, confirming that the molecules had attached to a layer of silane.
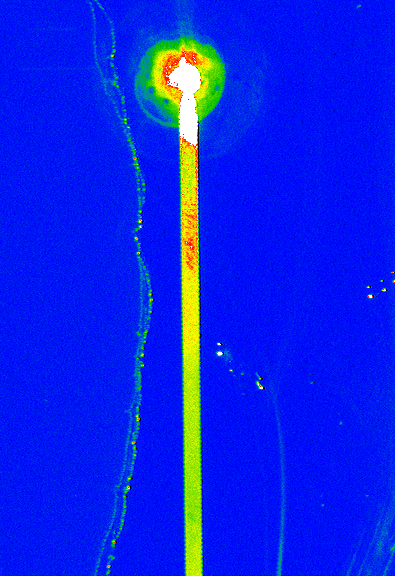
Fluorescence microcopy confirmed the successful vapor-phase silanization of a BioChipLab digestion module, by binding Cyanine3 phosphoramidite on the diol ending. The channel surface inside the assembled chip was activated using plasma before silanization. (F. Mittler / CEA-Léti)
Mass spectrometry
Finally, we attached trypsin, the enzyme, to the layer of silane in the microchannel of our module. We attempted the digestion of Cytochrome C, a small protein, and analyzed the results with mass spectrometry.
Initial results were promising, with a mass spectrum showing many of the expected peaks. The digestion might not have been complete, but this first result was an encouraging step towards further research.
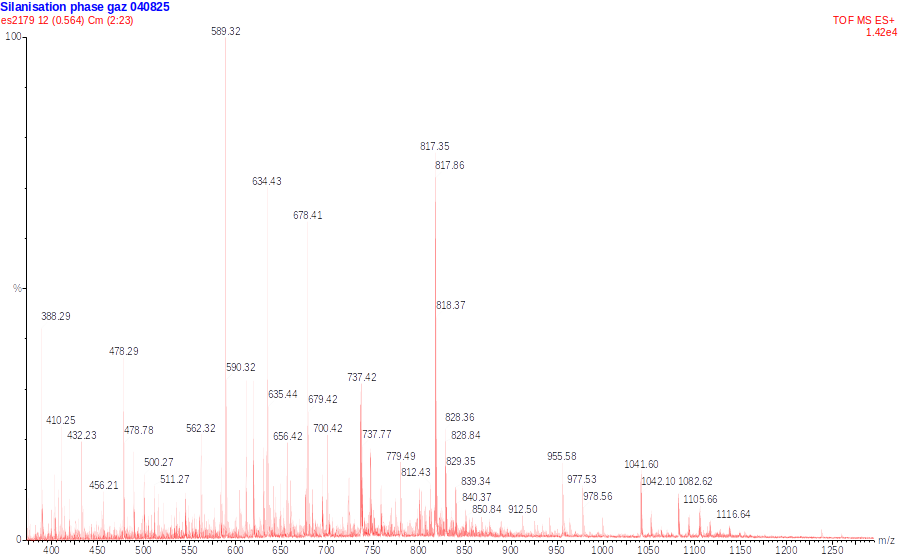
Mass spectrum of a sample of Cytochrome C (10 pmol/µL) digested by trypsine immobilized on a vapor-phase CEA-2 chemical layer. Green squares indicate peaks corresponding to expected peptides. (F. Mittler / CEA-Léti)
